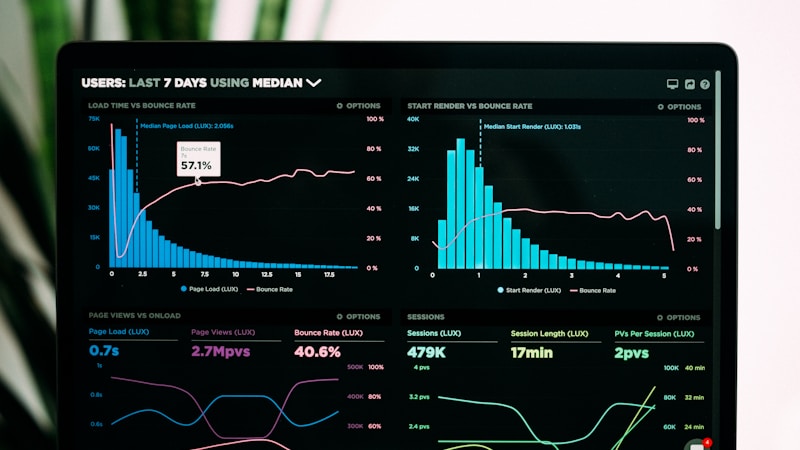
Not All Metrics Are Equally Important.
There are dozens of ways to measure website performance. Focusing on the metrics that impact user experience and business outcomes is what matters. Google's research shows that 53% of mobile users abandon a page loading longer than three seconds, and a one-second delay reduces conversions by 20%.
Here are the metrics we track for every client site at x13apps.
Core Web Vitals — Google's Performance Standard
Largest Contentful Paint (LCP) measures loading performance — how quickly the main content appears. Target: under 2.5 seconds. Common fix: optimize images, remove render-blocking resources, improve server response time. Interaction to Next Paint (INP) measures responsiveness — how quickly the page responds to user input. Target: under 200 milliseconds. Cumulative Layout Shift (CLS) measures visual stability. Target: under 0.1.
Time to First Byte (TTFB)
Measures server response time — how long before the server starts sending data. A fast TTFB is the foundation of a fast site. Target: under 800 milliseconds. Improve by using quality hosting, implementing server-side caching, using a CDN, and optimizing database queries. TTFB is often overlooked but affects every other performance metric.
First Contentful Paint (FCP)
When the first content appears on screen. Target: under 1.8 seconds. Affected by server speed, render-blocking resources (CSS, JavaScript), and network conditions. Reducing render-blocking resources typically has the biggest impact on FCP improvements.
Business Metrics Connected to Performance
Performance directly affects conversion rates, bounce rates, and revenue. Track how performance improvements correlate with business outcomes. A fast site is a competitive advantage. Improve the metrics that matter most to your users — not all metrics need to be perfect, but the ones affecting user experience should be. At x13apps, we include performance optimization in every web project.