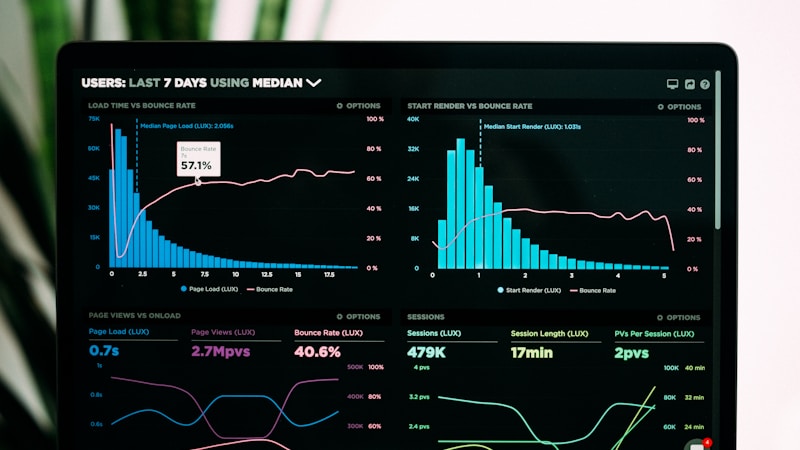
يؤدي الاختبار المنهجي إلى التحسين المستمر.
يقارن اختبار A/B (اختبار الانقسام) بين نسختين من صفحة الويب أو البريد الإلكتروني أو عنصر التطبيق لتحديد أيهما يحقق أداءً أفضل. وفقًا لتقرير صادر عن VWO عام 2025، فإن الشركات التي تجري اختبارات A/B مستمرة تشهد تحسنًا بنسبة 20-30% في معدلات التحويل على أساس سنوي. ومع ذلك، فإن 70% من اختبارات A/B تفشل في تحقيق نتائج ذات دلالة إحصائية بسبب سوء التصميم أو التنفيذ. نما سوق منصات التجارب إلى 1.2 مليار دولار أمريكي، حيث أدركت المؤسسات أن الاختبار ميزة تنافسية.
في x13apps، نقوم بإجراء تجارب تؤدي إلى نتائج موثوقة. هنا منهجيتنا.
اختيار ما يجب اختباره
إعطاء الأولوية للصفحات والعناصر عالية التأثير. ابدأ بالصفحات التي تتمتع بعدد كبير من الزيارات وأهداف تحويل واضحة. عناصر الاختبار ذات التأثير المحتمل العالي: العناوين الرئيسية، وأزرار الحث على اتخاذ إجراء، وعروض الأسعار، وحقول النماذج، والصور، وتخطيطات الصفحة، والتنقل. استخدم إطار عمل PIE (الإمكانات والأهمية والسهولة) لتحديد أولويات الاختبارات. قم بتحليل بيانات سلوك المستخدم (الخرائط الحرارية وتسجيلات الجلسة وتحليل مسار التحويل) لتحديد فرص التحسين. جمع ردود فعل نوعية من خلال الدراسات الاستقصائية واختبار المستخدم لإنشاء الفرضيات.
الدقة الإحصائية
حساب الحد الأدنى لحجم العينة قبل بدء الاختبار. استخدم تحليل القدرة لتحديد حجم العينة (عادة 80% قوة، 5% مستوى أهمية). إجراء اختبارات ذات دلالة إحصائية (ص< 0.05) before declaring a winner. Avoid peeking: do not check results early and stop tests based on interim results. Use sequential testing methods if you must monitor continuously. Account for multiple comparisons when testing multiple variants. Run tests for at least one full business cycle (one week minimum) to account for day-of-week effects.
الأخطاء الشائعة في اختبار A/B
إيقاف الاختبارات مبكرًا (الخطأ الأكثر شيوعًا). تشغيل عدد كبير جدًا من الاختبارات المتزامنة على نفس الصفحة. اختبار العناصر التي لا تحتوي على حركة مرور كافية للأهمية. إجراء تغييرات متعددة في اختبار واحد (متغيرات مربكة). تجاهل التأثيرات على مستوى القطاع. عدم مراعاة تأثيرات الجدة (يتصرف المستخدمون بشكل مختلف بسبب تغير شيء ما). استخدام اختبارات إحصائية غير صحيحة. استخلاص النتائج دون دلالة إحصائية. في x13apps، نقوم بتصميم تجارب صارمة تنتج رؤى قابلة للتنفيذ. للمزيد، اقرأ موقعنادليل الترحيل في Google Analytics 4.