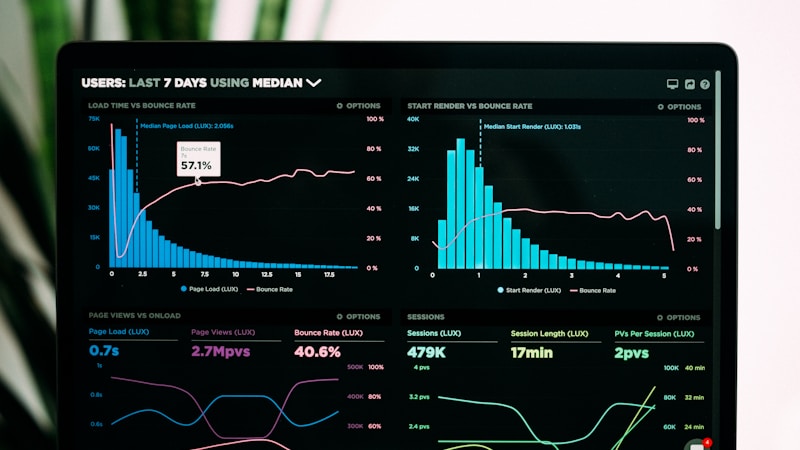
Los datos convierten a los visitantes del sitio web en información empresarial procesable.
La analítica web es la recopilación, medición y análisis de datos del sitio web para comprender y optimizar el comportamiento del usuario. Cada clic, vista de página y conversión cuenta una historia sobre lo que funciona y lo que no. Según un informe de 2025 de McKinsey, las organizaciones basadas en datos tienen 23 veces más probabilidades de adquirir clientes y 19 veces más probabilidades de ser rentables. Sin embargo, sólo el 30% de las empresas tienen una estrategia de análisis formal.
En x13apps, configuramos sistemas de análisis que brindan información clara y procesable. Estos son los conceptos básicos que todo propietario de una empresa debe conocer.
Elija la plataforma de análisis adecuada
Google Analytics 4 (GA4) es el estándar de la industria: es gratuito, potente y se integra con Google Ads y Search Console. Para alternativas centradas en la privacidad, considere Plausible, Fathom o Matomo. Cada uno ofrece diferentes compensaciones entre profundidad y simplicidad de datos. GA4 proporciona los datos más completos pero tiene una curva de aprendizaje. Las herramientas más simples son más fáciles de usar pero ofrecen menos granularidad.
Su configuración de análisis es tan buena como su implementación. Asegúrese de que el código de seguimiento esté instalado en cada página. Configure objetivos y eventos para acciones clave: envíos de formularios, clics en botones, reproducciones de videos y compras. Configure el seguimiento del comercio electrónico si tiene una tienda en línea. Pruebe su configuración utilizando herramientas como Google Tag Assistant antes de confiar en los datos.
Centrarse en métricas procesables
No todas las métricas son igualmente importantes. Concéntrese en las métricas vinculadas a los objetivos comerciales: fuentes de tráfico (de dónde provienen los visitantes), participación (páginas por sesión, tiempo en el sitio, tasa de rebote), conversiones (cumplimiento de objetivos, compras) y costo de adquisición de clientes. Las métricas personalizadas, como el total de visitas a la página, dicen poco sobre el rendimiento. Una página con 1000 visitas y sin conversiones es menos valiosa que una página con 100 vistas y 10 conversiones.
Configure paneles que resalten sus indicadores clave de desempeño. Revíselos semanalmente, no diariamente; las fluctuaciones diarias suelen ser ruido. Busque tendencias durante semanas y meses. Cuando identifique un cambio significativo, investigue la causa.
Comprender el comportamiento del usuario
Más allá de los números agregados, los análisis revelan cómo interactúan los usuarios con su sitio. Los informes de flujo de comportamiento muestran las rutas que siguen los usuarios a través de su sitio. Los análisis a nivel de página muestran qué páginas atraen a los usuarios y cuáles los alejan. Los datos de búsqueda del sitio revelan lo que buscan los visitantes: si muchos usuarios buscan el mismo término y lo abandonan, es posible que exista una brecha de contenido.
Convierta los conocimientos en acción
Los datos sin acción son sólo ruido. Cree un proceso de revisión analítica periódica: verificación rápida semanal, análisis profundo mensual y revisión de estrategia trimestral. En x13apps, configuramos sistemas de análisis que brindan información clara y procesable. Para obtener más información sobre decisiones basadas en datos, lea nuestroguía de marketing basada en datos.